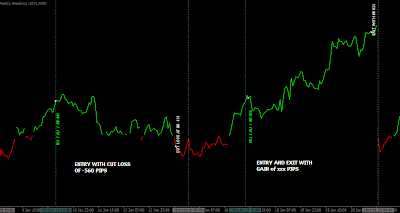
Since I am unable to illustrate the old entries, I have to show them with simulated backtest. Using mql4 programming I created simulated basket of 14 pairs and all my entry and exit. The simulated backtest is analyzed from 6 June 2011 to 7 May 2012 based on my variant of anchor breakout rules. The backtest result is quite similar to the old entries. Here is the few examples how does it looks like:
The lime lines are positive market trend (most buy pairs are gaining and most sell pairs are losing) and red lines are negative market trend (most sell pairs are gaining and most buy pairs are losing). Therefore, if my entry is long during positive market trend, I will be gaining pips.
The cut loss is set (for overall basket) at -560pips (average 40pips per pair). The exit every week is two hours before end of the week regardless of the result. Once the profit above 2800pips, the stop will set at 1400pips. For every week I waited for 36 hours from start of the week for the market to settle down. My trading period is from Hour 36 onward to Hour 96. Once the anchor fulfills my rules, I will enter in the direction of T101 anchor provided the market moved less than 480pips.
Week 50 (6 June 2011): Exit at loss -139
Week 49: Cut loss at -560
Week 48: Exit at profit +1209
Week 47: Exit at profit +2439
Week 46: No entry
Week 45: No entry
Week 44: Cut loss at -560
Week 43: Signal appears after hour 96. No entry
Week 42: Cut loss at -560
Week 41: No entry
Week 40: Exit at profit +35
Week 39: Signal appears after hour 96. No entry
Week 38: Exit at profit +1900
Week 37: Exit at profit +1111
Week 36: Exit at loss -235
Week 35: Exit at profit +2324
Week 34: Signal appears after hour 96. No entry
Week 33: Cut loss at -560
Week 32: No entry
Week 31: No entry
Week 30: Exit at profit +1342
Week 29: No entry
Week 28 (14 Nov 2011): Hit stop at +1400
Week 27: No entry
Week 26: No entry
Week 25: No entry
Week 24: Cut loss at -560
Week 23: No entry
Week 22: Exit at profit +502
Week 21: Holiday season. No entry
Week 20: Holiday season. No entry
Week 19: Cut loss at -560
Week 18: Exit at profit +831
Week 17: Exit at profit +509
Week 16: Exit at profit +446
Week 15: Exit at profit +147
Week 14: Exit at profit +1282
Week 13: Exit at profit +1074
Week 12: No entry
Week 11: Exit at loss -39
Week 10: Exit at profit +1104
Week 09: Cut loss at -560
Week 08: Cut loss at -560
Week 07: No entry
Week 06: Cut loss at -560
Week 05: Exit at profit +1037
Week 04: Exit at loss -306
Week 03: Exit at profit +1358
Week 02 (7 May 2012): Exit at profit +462
----
Results for 49 weeks
No entry: 17 times
Exit with profit: 18 times
Hit profit stop: 1 time
Cut loss -560: 9 times
Exit with loss: 4 times
Total gain: +20512 pips
Total loss: -5759 pips
Net: +14753 pips
Summary
Overall T101 is not as "holy grail" as the legend goes, or perhaps my variant is not working very well. In total 19 gain vs 13 loss with net result of +14735 pips gain. Sorry if I have disappointed you if you are speculating T101 would produces 20,000 pips per month. The chart above shows the market trend for every week. Good week with trending market produces exceptional results while you will be stopped out in choppy week.
Next - T101 Anchor Breakout - The Result 2


